Understanding forest snow interception

I am no expert in snow hydrology but I do recognize the importance of being able to estimate the amount of water captured in a snow pack and to be able to forecast snow melt rates. The University of Washington is actively researching this. They have enlisted the help of volunteers through the Zooniverse crowd sourcing platform. In the past, I have partaken in the Zooniverse hosted Operation War Diary which applies the same principle: recruit the help of very many volunteer non-experts to help execute tasks that cannot possibly be done by researchers alone.

From the Snow Spotter web page:

We have placed time-lapse cameras throughout Olympic National Park in order to better understand how much snow is in forests.
Watersheds can be dominated by forests and snow provides a natural storage of fresh water. Forests can intercept up to 60% of the total annual snowfall and 25-45% of the intercepted snow can be lost from the watershed back to the atmosphere through sublimation. Forest interception thus plays a vital role in our understanding of how much snow is in forests.
The photography will give us a qualitative rank/order description of how much snow is in the trees and inform us on how long the snow lasts in the trees. Through your help we hope to better understand forest snow interception and ultimately how much fresh water storage we have to last us through the dry season.
When helping to classify, you will be directed to different images and be prompted to rank the amount of snow in the tree. Don’t be worried if some of the images are fringe cases where you cannot decide how to rank it, just make your best guess!

So, if you have a bit of time on your hands, please condider participating in Snow Spotter. It’ll be fun in the process you may learn a thing or two!

snow-spotter

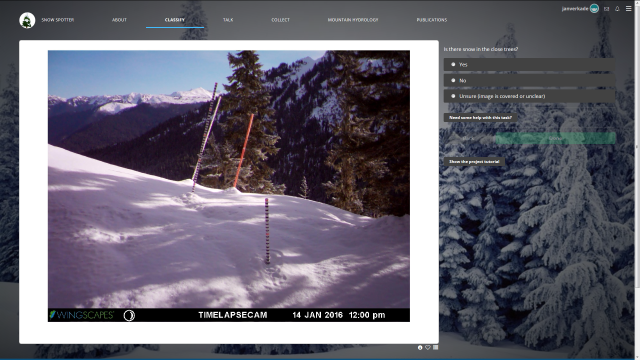
This is how you’d classify a snow pack within Snow Spotter.

Posted in Hydrology, ResearchTools | Leave a comment

Muskingum routing: theory, example and a brief venture into linear algebra

For a project, I needed to re-familiarize myself with the concept of Muskingum routing. I looked up the theory, found a working example and coded the thing in R. As I suspected I could make the calculation more efficient by using linear algebra (how wrong I was!), I also took the matrix route. Finally, as I was looking to get some experience with R Markdown I wrote the whole thing down. For reference. It’ll be useful for myself and maybe also for others. Anyway – the results are in this document. Happy Reading!

muskingum

Posted in Hydrology, ResearchTools | Leave a comment

Warmte-Koudeopslag (WKO): energiebalans

Laatst vroeg een vriend of ik eens wilde kijken naar de energiebalans met betrekking tot de koude-warmte-opslag die hij voor zijn werkgever beheert. Het bedrijf moet periodiek rapporteren aan het (door de provincie ingehuurde) agentschap “Omgevingsdienst Haaglanden”. Het agentschap gebruikt daarvoor een rekenblad doch daarin zijn de vergelijkingen niet ingevuld (…). Enfin, bijgaande .pdf doet uit de doeken hoe de berekening eruit ziet. Bijgaande .xls laat dat nog eens zien in het gevraagde spreadsheet-formaat.

Vragen/opmerkingen zijn natuurlijk welkom.

WKO-berekening.pdf
wko-rekenvoorbeeld-omgevingsdienst-haaglanden.xls

Naschrift (mei 2017): ik werd er vriendelijk op gewezen dat de eerste versie van de berekening onjuist was. De soortelijke warmte van water is ~4200 J/(kg K) en niet ~4,2 J/(kg K). Dat is nu hersteld; nieuwe bestanden zijn geüpload. Dank, Raimond!

Posted in Uncategorized | 1 Comment

“Predictive uncertainty” seminar – April 1, 2015, Faculty of TPM

The future is uncertain. Forecasting reduces this uncertainty but cannot eliminate it. Residual uncertainty remains. Risk management requires that these residual uncertainties are adequately characterised. Techniques for characterisation vary from probabilistic forecasting to scenario based forecasting, depending on the nature of the uncertainties.

The present seminar will highlight some techniques for characterising uncertainties about the future as well as approaches for managing these uncertainties for the purpose of decision-making and, in the context of hazard management, maintaining required safety levels. Speakers will discuss a range of uncertainties and decision-making approaches. See below programme for details.

The seminar is organised at the occasion of the defence of the dissertation “Estimating real-time predictive hydrological uncertainty” by Jan Verkade. The seminar will take place on April 1, 2015 from 13:00hrs onwards at Delft University, Faculty of Technology, Policy and Management, Room B.

Participation is free but we do ask that you register via http://bit.do/pred-unc-seminar

The seminar is sponsored by

  • Delft Safety & Security Institute (DSyS)
  • Delft Infrastructures & Mobility Initiative (DIMI)

13:00

Venue open 

13:30

Pieter van Gelder

(Delft University of Technology)

Welcome and introduction


Block I: real-time
predictive hydrological uncertainty

13:40

Kristie Franz

(Iowa State University)

Challenges
of improving streamflow prediction through remote
sensing data applications

14:00

Hannah Cloke

(University of Reading)

Forecasting the 2014 England and Wales floods: the role of forecasting
and uncertainty

14:20

Marie-Amélie Boucher

(Université du Québec à Chicoutimi)

Multimodel hydrological forecasts for hydropower production


14:40

Coffee break


Block II: predictive uncertainty in related
disciplines

14:55

Hans van Lint

(Delft University of Technology)

Predictive uncertainty in traffic management

15:15

Warren
Walker

(Delft University of Technology)

Adapt or
Perish: An Approach to Planning Under Deep Uncertainty

15:35

Ibo van der Poel

(Delft University of Technology)

Uncertainty: a philosophical perspective

15:55

Jaap Kwadijk

(Deltares; Twente University)

Anticipating
Change: Enabling Delta Life for Future Generations


16:15

Jan Verkade

(Deltares; Delft University of
Technology; Rijkswaterstaat)

Closure

16:30 – 17:30


Drinks

Posted in Uncategorized | Leave a comment

Proefschrift, verdediging en feest!

(For English, scroll down)

Het Proefschrift
Mijn proefschrift is hier te downloaden. De bijbehorende stellingen kun je hier downloaden.

De Verdediging
Op woensdag 1 april verdedig ik mijn proefschrift in de Senaatszaal van de Aula van de TU Delft. Om 9:30 uur begint het lekenpraatje, gevolgd door de eigenlijke verdediging om 10:00 uur. Adres: Mekelweg 5, 2628 CC, Delft.

Het Feest!
De goede afloop van de verdediging wordt gevierd op (Goede) vrijdag 3 april vanaf 8 uur ‘s avonds. Over de locatie wordt nog nagedacht, maar vrijwel zeker wordt het ergens in het centrum van Delft.

RSVP!
Ben je van plan om de verdediging en/of het feestje bij te wonen? RSVP!

=========================

The dissertation
My dissertation can be downloaded from here. The propositions can be downloaded from here.

The defence
On Wednesday, April 1st, I will defend my dissertation in Delft University of Technology’s “Aula” Congress Centre, in the “Senaatszaal”. At 09:30h, there will be a “layman’s introduction”, followed by the defense (10:00h), which in turn is followed by a reception. The address: Mekelweg 5, 2628 CC, Delft.

Celebrations!
Assuming everything will go as planned, celebrations are planned for Friday, April 3rd from 8pm onwards. We’re still thinking about the venue, but it’s likely to be in the centre of Delft.

RSVP!
Are you planning to attend the defense and/or the celebrations? RSVP!

Posted in Predictive uncertainty | Tagged | Leave a comment

Our article on statistically post-processing ECMWF weather re-forecasts for use in operational streamflow forecasting

Recently, James Brown, Albrecht Weerts, Paolo Reggiani and myself published a research article on statistically post-processing ECMWF-EPS weather re-forecasts for use in streamflow forecasting.

Graphical abstract

Graphical abstract

The article’s highlights can be summarized as follows:

  • ECMWF ensemble reforecasts of precipitation and temperature were tested for biases.
  • An attempt was made to reduce these biases through statistical post-processing.
  • This resulted in modest improvements in the quality of the forcing ensembles.
  • The effect on streamflow ensembles was explored by verifying against simulated flow.
  • At all spatial scales considered, the improvements in streamflow quality were muted.

The manuscript has been published in Elsevier’s Journal of Hydrology. In due time, it will constitute one of the chapters of my PhD dissertation. An author copy can be downloaded from here. The paper’s full reference is:

Verkade, J. S., Brown, J. D., Reggiani, P. and Weerts, A. H.: Post-processing ECMWF precipitation and temperature ensemble reforecasts for operational hydrologic forecasting at various spatial scales, Journal of Hydrology, 501, 73–91, doi:10.1016/j.jhydrol.2013.07.039, 2013.

Note added (December 3, 2014): I recently presented the results of this work at the November 2014 “H-SAF and HEPEX workshops on coupled hydrology” (link). The slides I used can be downloaded from here.

Posted in Forecasting, Predictive uncertainty, Probability forecasting | Leave a comment

Webinar on ‘pre-processing’ in hydrologic forecasting

Wednesday, March 27th, I’ll be giving a webinar on pre-processing in hydrologic forecasting. The webinar is part of a new series of online presentations that are part of the HEPEX initiative. It is hosted by ECMWF and starts at 4pm CET. Full details of how to join the webinar are found here.

graphical-abstract

The webinar’s full title is “Post-processing ECMWF precipitation and temperature ensemble reforecasts for operational hydrologic forecasting at various spatial scales”. The accompanying abstract reads as follows:

The ECMWF temperature and precipitation ensemble reforecasts are evaluated for biases in the mean and spread, and how these biases propagate to streamflow ensemble forecasts. The forcing ensembles are subsequently post-processed to reduce bias and increase skill, and it is investigated whether this leads to improved streamflow ensemble forecasts. Multiple post-processing techniques are used: quantile-to-quantile transform, linear regression with an assumption of joint normality and logistic regression. Both raw and post-processed ensembles are run through a hydrologic model of the river Rhine to create streamflow ensembles. The results are compared using multiple verification metrics and skill scores: relative mean error, Brier skill score and its decompositions, mean continuous ranked probability skill score and its decomposition, and the ROC score. Verification of the streamflow ensembles is performed at multiple spatial scales: relatively small headwater basins, large tributaries and the Rhine outlet at Lobith. The streamflow ensembles are verified against simulated streamflow, in order to isolate the effects of biases in the forcing ensembles and any improvements therein. The results show that the forcing ensembles contain significant biases, and that these cascade to the streamflow ensembles. Some of the bias in the forcing ensembles is unconditional in nature; this was resolved by a simple quantile-to-quantile transform. Improvements in conditional bias and skill of the forcing ensembles vary with forecast lead time, amount, and spatial scale, but are generally moderate. The translation to streamflow forecast skill is further muted, and several explanations are considered, including limitations in the modelling of the space-time covariability of the forcing ensembles.

The presentation is based on research that James Brown, Albrecht Weerts, Paolo Reggiani and myself have conducted. A manuscript describing this research has been accepted for publication in Journal of Hydrology, pending ‘moderate’ revisions.

Posted in Forecasting, Hydrology, Predictive uncertainty, Probability forecasting | Leave a comment

2012 in review

The WordPress.com stats helper monkeys prepared a 2012 annual report for this blog.

Here’s an excerpt:

600 people reached the top of Mt. Everest in 2012. This blog got about 5,400 views in 2012. If every person who reached the top of Mt. Everest viewed this blog, it would have taken 9 years to get that many views.

Click here to see the complete report.

Posted in Uncategorized | Leave a comment

“Probability Forecast Use – selected experiences” – my talk at FloodRisk2012

This afternoon, at the FloodRisk2012 conference in Rotterdam, I will present on the findings of the Probabilistic Forecast Use project that we’re currently finalising.

There is a strong theoretical rationale for using probabilistic rather than deterministic forecasts. Currently, however, there exist no best practices for effectively using probability forecasts. In the project, we tried to contribute to the development thereof. I think we achieved quite a lot. The main findings I am presenting on this afternoon are:

  • Hydrological forecasting community supplies hazards whereas often, users are more interested in consequences
  • Manipulating – not understanding – probabilities is an issue; asking the right question of a forecast largely resolves this.
  • Disclaimers apply to the risk rationale

There’s more to say about the topic, obviously. Have a look at attached presentation slides and let me know what you think! If you can make it to the conference: today, Wednesday November 21st, 4pm, room 6.

Posted in Forecasting, Predictive uncertainty, Probability forecasting | Leave a comment

“Mount Ruapehu about to burst”

Wednesday update: there has been an eruption alright… of neighbouring Tongariro!

A few years ago my partner and I hiked a six-day tour of Mt Ruapehu. This is a beautiful mountain, probably best known outside of New Zealand for its role as Mount Doom in one of the Lord of the Ring films.To the geological community, it is known as an active volcano which’ eruptions has lead to lahars in the past, sometimes with many fatalities as a result.

The title of this blog post is an exaggeration of the truth, of course, but the fact is that the NZ Department of Conservation has issued a warning:

A Volcanic Alert Bulletin issued today by GNS Science summarising recent measurements at Ruapehu indicates the likelihood of eruptions from the mountain has increased.

There is no certainty that an eruption will take place of course, and I am guessing that the uncertainty cannot be characterised by a probability estimate.

Some links:

Posted in Uncategorized | Leave a comment